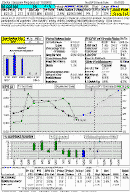
INTEGRATED COMPANY ANALYSIS  (ICA)
Fundamental Charting and Graphical Analysis


The Integrated Company Analysis (ICA) software is an advanced fundamental charting and graphical analysis program.

It was designed designed to quickly and easily evaluate the investing attractiveness of a company.

Access over 8,800 stocks with over 350 different fundamental ratios to choose from. All charted and graphed for visual analysis.

There's nothing else like it!


Price Action - Analyze the price impact of fundamentals. Overlay price charts with:

  • EPS Surprises

  • Consensus Estimates

  • Annual, Quarterly or 12-month EPS

  • EPS Trend

  • Zacks Rank/Indicator

  • ROE & ROA

  • Broker Recommendations

  • Sales

  • Net Income

  • Operating Margin


click here for slideshow

- You can also analyze a stock's performance vs. other stock(s), it's Industry, Sector, or over 40 other major Indexes and Aggregates.

And now, for a LIMITED TIME ONLY, you can get it for ONLY  $299

Regularly $1,500 yr., it's now being offered in a special limited promotion to:

  --  Current, Renewing and New,
      Research Wizard Subscribers

for ONLY $299

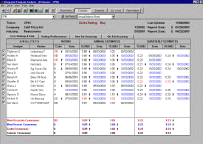
Detailed Estimates - See the flow of estimate revisions and recommendations from over 300 brokerage firms plus individual analyst's track record.

Get the latest information on individual broker recommendations, annual and quarterly EPS estimates and revisions, analyst Consensus, and Zacks' Ratings for over 6,500 companies. You can also see the Analyst's Track Record and and the Historical Ratings of the Analysts.


click here for slideshow


If you're a Current RW Subscriber, you know how powerful the Research Wizard is. Take advantage of this special ICA offer and increase your stock picking power to a new level.

If you're a soon to be Renewing RW Customer, renew NOW and take advantage of this limited time promo.

And if you're thinking about becoming a New Research Wizard Subscriber, act NOW and get started today. There's never been a better time!!!

 
Zacks Snapshot Reports
- A one page, full color report, displaying all of the key decision making info., in one easy to read report. It features:

  • Company Description

  • Actual and Estimated EPS

  • Co. vs. Industry Ratings

  • Key Fundamental Data

  • Broker Ratings & Zacks' Rating

  • Price Charts

  • And More ...


click for here for details
 

Ready to GET STARTED with the Integrated Company Analysis program,
or the Research Wizard & ICA

Call
Kevin Matras at:
1 (800) 767 - 3771,  ext 392
or
e-mail: kevinm@zacks.com


Company vs. Industry Analysis
- Use easy to read Graphs to see how a company is performing versus its Industry, its Sector, the S&P 500, or a specific number or value, from a wide range of over 350 different fundamental items.

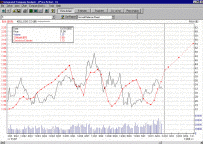
Sizing up a company has never been so easy.


click here for slideshow


Peer Analysis
- Compare a company's fundamental data to other companies (peers) in its industry. Or your create your own custom peer group for comparison.

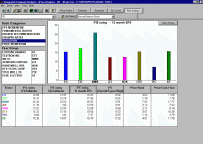
Quickly determine the leaders and the laggards in an industry by charting and graphing any of over 350 different fundamental and financial items.


click here for slideshow

 
Internet-Based Reports - Access various Reports and Fundamental Data Tables.

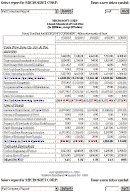
Business Description & Management Discussion Reports, Insider Trading Data, Income Statements, Balance Sheets, Cash Flow Tables, Brokerage Research Reports and their Abstracts, and more.

View actual Statements or 'Standardized' reports for quick and easy comparisons between companies.


click here for details

 
Learn more about the Research Wizard