|
Before |
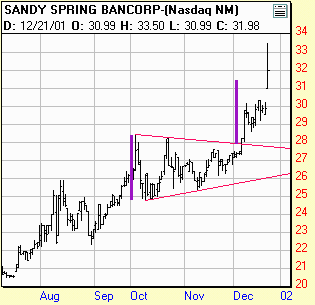
After |
 |
 |
|
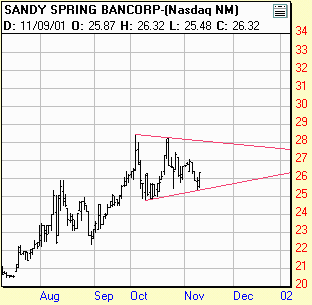
'Before' shot / from PRS, Vol. 1, No. 2 |
'After' shot / + $5.66 or +21.50% |
| (Back adjusted price for 3 for 2 stock split on 12/21/01.) | |
|
|
|
|
That's a $3.50 base. ($28.37 pattern high, minus a $24.87 pattern low, equals a $3.50 base.) Simply add $3.50 to the breakout point (in this case it was approximately $27.65), for your measured move target of $31.15. As you can see, sometimes they go even higher. When the market blows past the measured target with impunity, I will generally stay in, using a move below my measured target as my new stop-out point. |
|
|
|
|
|
There are several ways to trade chart patterns. The
most common way is to buy (if it's a bullish continuation pattern like
this 'symmetrical' triangle example), once it breaks out through the top
of the pattern. (Descending red line). However, many traders (myself
included), can opt for a lower risk entry by getting in as soon as the
pattern is identified, in anticipation of an eventual breakout. |
|